Centralizing organizational revenue reporting in Power BI
Power BI · Power Query · DAX · Star Schema
Leadership relied on fragmented monthly reports maintained separately across programs, which made reporting slow, inconsistent, and difficult to explore. I consolidated the reporting process into a centralized Power BI dashboard that standardized revenue data across the organization and replaced manual reporting workflows.
The short version
The organization relied on disconnected monthly reports produced separately across programs. I replaced the process with a centralized Power BI reporting system built on a star schema data model, standardized revenue structures, and custom DAX measures. Leadership gained one centralized reporting view across all revenue streams while monthly reporting time dropped by roughly 89%.
The problem
Revenue reporting was fragmented across multiple programs, each maintaining separate files and reporting structures. Producing leadership reports required manually consolidating information from different sources every month, which created reporting delays, inconsistent definitions, and limited visibility into organizational performance.
Leadership could not interact with the data directly. Any follow-up question required additional manual work, and by the time reports were assembled, the information was often already outdated.
What I did
I designed and built a centralized Power BI reporting system that consolidated revenue data across the organization into a single dimensional model. I first standardized the underlying data structures across programs using Power Query, then organized the model using a star schema architecture with one fact table and supporting dimension tables for date, source, payment method, program category, and description.
I then developed DAX measures to calculate organization-wide KPIs, including total revenue, average transaction size, revenue trends over time, and revenue breakdowns across programs and payment methods. The dashboard included KPI summaries, trend analysis, revenue breakdowns, and interactive filtering by year, month, category, and payment method.
The reporting process moved from separate static reports toward a centralized reporting structure that leadership could explore directly without requesting additional report preparation.
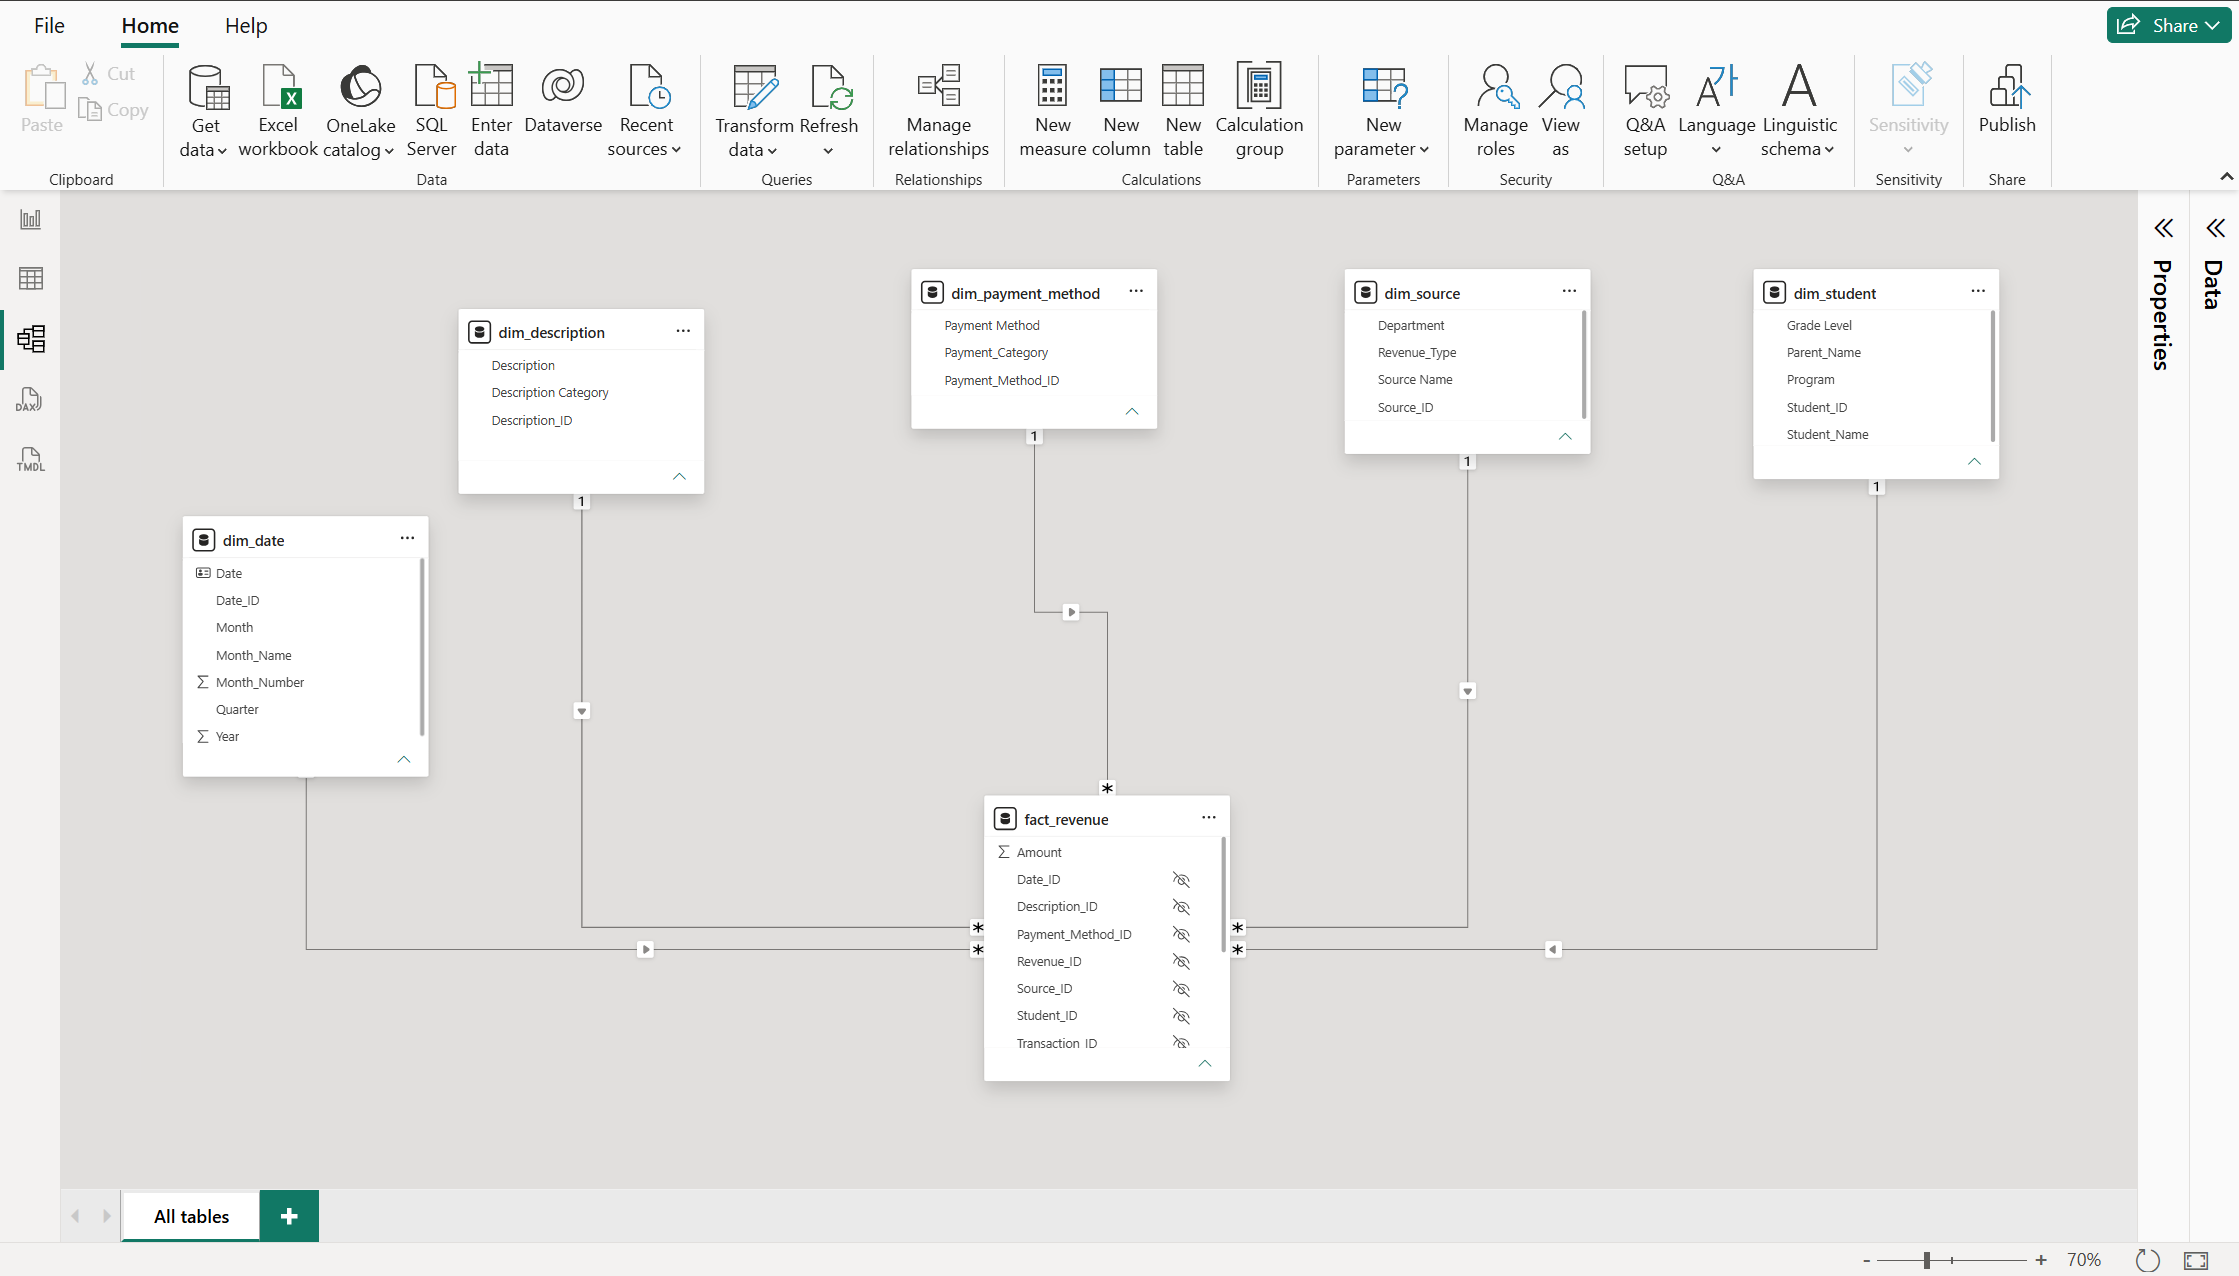
The underlying dimensional model used to standardize reporting across revenue sources.
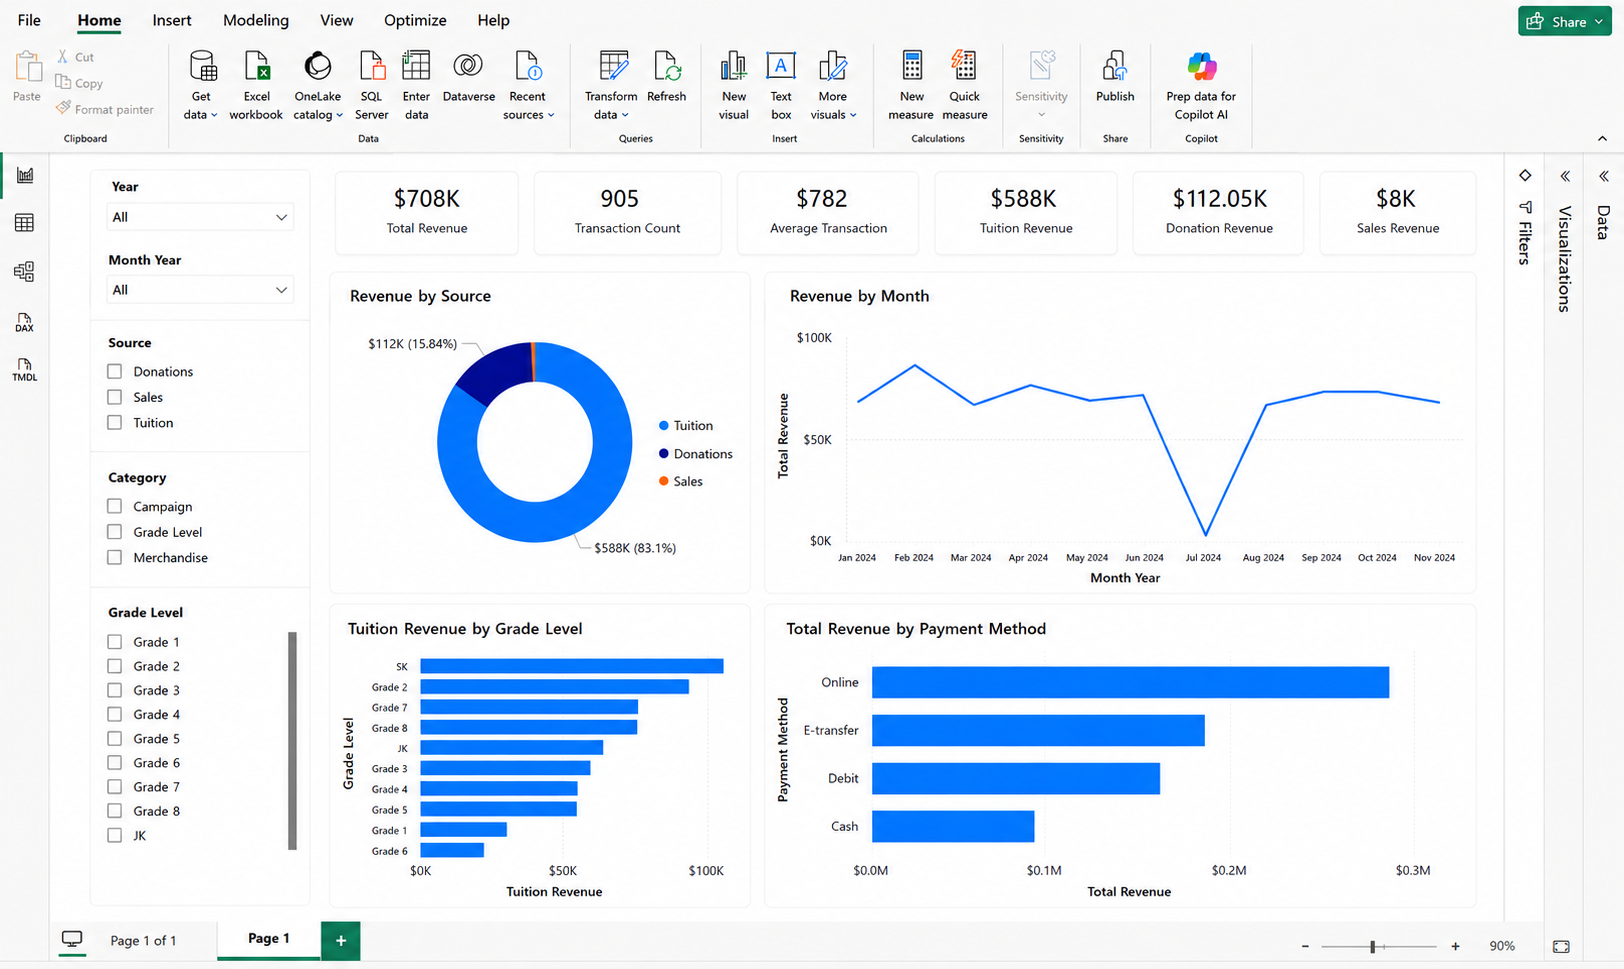
The final Power BI dashboard used for organizational revenue reporting.
What changed
Outcome 01
Monthly reporting time dropped by roughly 89%.
Manual report consolidation was replaced with an automated reporting workflow. Time previously spent collecting and assembling spreadsheets shifted toward analysis and operational review.
Outcome 02
Leadership gained direct access to revenue reporting.
Interactive filtering reduced dependency on manual follow-up reporting and allowed leadership to explore revenue trends, compare programs, and review organizational performance directly through the dashboard.
Outcome 03
Revenue reporting became standardized across programs.
Consolidating the reporting structure reduced inconsistencies between departmental reports and created a centralized reporting view across revenue sources.
Why this project matters
This project involved consolidating fragmented data sources, standardizing reporting structures, building a dimensional model, and developing reusable reporting logic in Power BI. The same type of work appears across analytics functions, including people analytics, finance analytics, and operational reporting teams.